


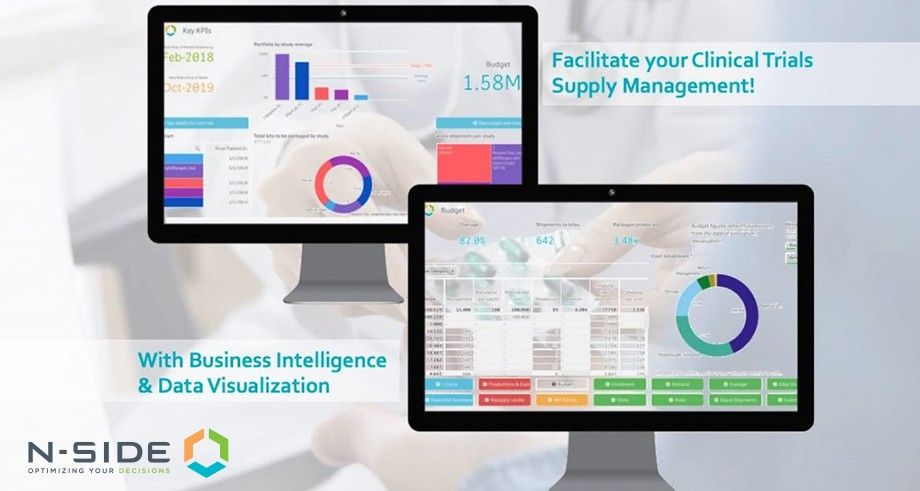
Visualizing your clinical trial supply forecasts at portfolio-level helps strategic and operational decision-making.
By intuitively interacting with your optimized data at this level, you have a clear overview of your portfolio and can immediately identify areas of improvement.
Using an advanced optimization tool for clinical trial supply management, combined with business intelligence dashboards, such as the N-SIDE Supply App, enables portfolio-level measures to be visualized on demand. By using Supply App, there is a standardized process for collecting and approving assumptions for inputs, as well as for forecasting, and reporting, so there is assurance the same types of information can be compared across studies.
Additionally, current study data are leveraged for ongoing trials using machine learning techniques to ensure the most up to date information about each trial is incorporated into the dashboards. Metrics on topics including packaging releases, patient demand, the number of shipments, site and depot inventories, budget, and risk should be considered to provide a broad scope, while allowing for cross-topic analysis.
Identify
By having a portfolio-level view, aspects of supply management that require action are immediately highlighted. For example, the first metric you wish to appear on your dashboard may be the risk incurred by a missed patient dispense visit. At this point, it is easy to drill down to see which study (or studies) carries the most risk, in which country, and how likely it is to happen. With this information, the best risk mitigation plan can be formulated. From there, the patient demand for a certain kit across protocols can be viewed as well as the packaging release plan. Identifying this risk in advance can proactively inform changes that may need to be made to the packaging release timing or quantity.
Analyze
Analysis is made easy by drilling down to different levels of data. For example, in analyzing sources of overage, it is possible to go further than the overall overage per study. By measuring the amount of kits expiring unused at depots and at sites across all trials, dominant causes of overage in the portfolio can be analyzed. In one case, it was observed that there were high levels of overage at the central depot. By drilling down, it was found that for a specific compound, there had been many local depots required in the network. This drove the level of buffers kept centrally to a higher than usual level. By interacting intuitively with the data, the root cause was easily identified.
Decide
Take, for example, budget information. As Supply App forecast outputs are broken out by budget category, it is easy to spot if there is an area of the budget that is higher than planned; investigate the cause and decide future actions. A quick glance at the portfolio budget by cost category could reveal a higher than planned cost of VAT and customs fees. This could then translate into a strategic decision to control the number of countries requiring high customs fees in the next studies planned.
Plan
Having a portfolio-level view is invaluable for planning. It is one thing to know that for one study, there will be a peak in the number of site shipments required six months from now. By itself, this amount of site shipments may not pose a problem. However, by looking at this same measure – the number of site shipments per month, across the portfolio, may reveal the peak in the number of site shipments during a certain month is exceptionally high. Drilling down to the depot-level can reveal if the peak exceeds normal operating levels at any of the depots. This gives time to react, and make decisions related to workforce and logistics in order to manage peak levels.
Portfolio-level visualization of your clinical trial supply forecasts helps planning, analysis and decision-making. Using Supply App ensures a standardized process for calculating different metrics that are then aggregated into a business intelligence dashboard. This overcomes the challenges of having an up to date portfolio view, while providing an intuitive way to leverage your data.
Do you want to know more?
